Pages

Wednesday, September 17, 2014

Diverse collaborations generate greater scientific splash

Overview: The search for what makes the most creative and successful scientific teams

The work I discuss can be found on today's NATURE at Collaboration: Strength in diversity. The piece is a prelude to as-of-yet unpublished work by Richard Freeman and Wei Huang who are economics researchers from Harvard University and are in the process of publishing their mentioned work in the Journal of Labor Economics.

Here, the authors hypothesize that scientific collaborating groups of high ethnic diversity are more likely to result in high-impact scientific publications. In their work, they data-mined over 2.5 million research articles stretching across 11 scientific fields dating from 1985 - 2008 where all authors had US addresses. Using surnames to derive author ethnicity and journal impact factor or citation count as a measure of scientific impact of the article, the authors looked for trends between impact factor/citation count and article ethnic diversity. They attempted to control for group size and ethnic population densities, although it is yet unclear the exact methods. Their key findings were:

  • Authors of a given ethnicity were more likely to co-author with others of the same ethnicity than expected by chance (this phenomenon they refer to as homophily).
  • Groups of increased ethnic diversity tended to publish higher-impact papers as compared to those with lower diversity.
  • Group of increased ethnic diversity also tended to publish papers of slightly higher citation count as compared to those with lower diversity.
The authors conclude that ethnicity does have significant impacts on resulting scientific works and publications. They hypothesize that different ethnicities might be associated with different innate differences that would complement each other in a collaborative setting. An alternative hypothesis is that collaboration between ethnic groups might act as a selective pressure: there might be difficulties unique to cross-ethnic groups (ie. linguistic, cultural) which could drive forward only those groups that are successful in overcoming these hurdles. These findings are interesting but are purely descriptive and correlation-based with mechanistic details still elusive. Here, the network effects on scientific output is limited to 1-degree but this does help promote additional endeavors to incorporate larger social networks for similar-type analyses.

Strengths of study:

Study motivation:
The overarching motivation for this study is understand what makes a successful scientific group. This is comparable for many to understanding what makes a successful athletic team, business, etc. This in-itself is a worthwhile goal.

Strength in numbers:
The studies uses data from 2.5 million publications spanning over two decades across multiple disciplines. This is definitely a big data project where significant results are most likely reliable.

Implications of the workplace:
This work also supports ethnic diversity in the work-place. If the key findings are correct and can be extrapolated outside of science, then ethnic diversity should positively correlate with work-place productivity and group success.

However, this would be heavily dependent on the precise definition of success and whether all or most group members have the same definition. In science, there is a saying: "Publish or perish". Meaning, either publish or you risk losing your funding. Most would agree that the higher the impact of the publications, the lower the chance of losing it. Here, it would seem plausible that most scientists see publication as one measure of success.

Drawbacks of study:

As this is a descriptive study with a dearth of reliable mechanistic explanations, I would not put "all my eggs in one basket" here.

Definitions:
Using surnames to predict ethnicities can be quite misleading, especially in the US (land of the immigrants). It does seem reasonable that the majority of surname-ethnicity predictions can be right, but there should still be a significant amount of incorrect predictions due to mixed ethnicity, marriage surnames, adoptive surnames, etc. In addition, there are a multitude of covariates that would be incredibly difficult to tease out in a large data-set as this. For example: family history, education history, experience in the discipline, study topic within each desipline, etc. It would be very interesting if a principle component analysis (PCA) would reveal ethnic diversity has a driving factor even in light of all other possible factors accounted for.

Weight distribution within the author social network:
It appears that each author on a paper is treated with equivalent weights. If this is truly the case, this might also obfuscate the study findings. Collaborations are driven largely by the corresponding authors (ie. the project supervisors). Therefore, it might be the case that papers with 1 corresponding author might be more likely to contain low diversity groups (basically restricted to their local lab group). However, papers with multiple corresponding authors would have contributions across multiple labs, possibly across institutes. An important (largely unspoken) criteria in selection of publications by journals is diversity of corresponding authors. If you are to publish with 1 or more renown experts within the field, you would be more likely to have a higher impact paper. In this paradigm, publication success might be driven predominately by who the corresponding authors are.

Overall:
I think this work is interesting in its own right, however it leaves the door open for many questions. But then again, that is the nature of research.
Saturday, November 16, 2013

Cytoscape: Getting Started Part 1

Cytoscape: It's installed, now what?
Intended audience:
Those who have already installed Cytoscape, have found the official Cytoscape tutorial, but still have little idea of what to do.

Background:
       I have noticed for some time, both my graduate colleagues and others that I have met at conferences seem to be quite annoyed with Cytoscape. A brief description of Cytoscape; it is a software commonly used to visually construct networks with nodes and edges (I am more interested in the biological networks). With the plethera of data out there, visualization is absolutely critical to helping other understand networks. In addition, Cytoscape can be used in conjunction with several "plugins" (which are basically functional Cytoscape software extensions) in order to calculate or better visualize any given network.

       As a sidenote, I will be using Cytoscape 2.8.3 for my tutorial. I suspect that, at least for all the core basics, different versions of the software will not vary too much.

Getting started 101:
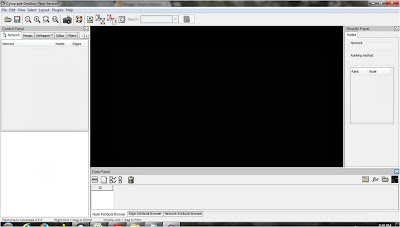
Initially, this is (more or less) the software screen you get when you first open the application.

The first thing you want to do is import the data that will be used to construct your visual network. The great thing about Cytoscape is that it was built with Notepad or Excel in-mind. I am comfortable with Excel so I will use it to build my network consisting of protein-protein interactions (ie. I would have a list of which protein interacts with which protein).

Data import format:
The format is as such:

In this example, I have paired up my protein pairs such that I know SPAC1002.06C interacts with SPAC6G9.13C (the very first pair). Likewise, the second, third, and so forth lines represents other pairs. Cytoscape has a built-in feature which can easily remove all instances of duplicate pairs so if this is a problem, do not worry -- we will get to that soon!

Importing the data:
To upload your Excel file, go to FILE > IMPORT > Network from Table (Text, MS Excel)....

Make sure to select the appropriate columns for "Source Interaction" and "Target Interaction". Cytoscape also has an "Interaction Type" function in-case you have a file with multiple types of interactions (ie. a combination of protein interactions and genetic interactions). In our case, all pairs represent the same type of interaction (protein-protein). However, if multiple types of interactions are present and indicated by "Interaction Type", then different types of edges can be differentiated.

Importing attributes:
In Cytoscape, attributes are various descriptions of the nodes in your network. Let's say

Playing with the network:
This is the part that takes some time to explore.

Let Cytoscape organize your network-look in several ways:
Cytoscape allows you to manually drag nodes (the circles) and/or edges (the lines) however you want on the main screen. However, it is often best to let Cytoscape organize the "shape" of your network based on various built-in algorithms (more can be imported via plugins).

Starting with the upper toolbar, go to LAYOUT > Cytoscape Layouts. Choose any layout and see how it changes your network look. The layout seen above is Force-directed layout > (unweighted).

Zoom-in/ Zoom-out:
You can zoom in or out of the network by either scrolling with you mouse or using the zoom functions in the upper-left corner (the  two Magnifying Glasses).

In the lower left corner, there is a global view of your network with a blue rectangle over it. The blue rectangle tells you how much of your network you are currently seeing in the main  screen (the bigger area spanning the middle to upper-right of the screen).