Intended audience:
Those who have already installed Cytoscape, have found the official Cytoscape tutorial, but still have little idea of what to do.
Background:
I have noticed for some time, both my graduate colleagues and others that I have met at conferences seem to be quite annoyed with Cytoscape. A brief description of Cytoscape; it is a software commonly used to visually construct networks with nodes and edges (I am more interested in the biological networks). With the plethera of data out there, visualization is absolutely critical to helping other understand networks. In addition, Cytoscape can be used in conjunction with several "plugins" (which are basically functional Cytoscape software extensions) in order to calculate or better visualize any given network.
As a sidenote, I will be using Cytoscape 2.8.3 for my tutorial. I suspect that, at least for all the core basics, different versions of the software will not vary too much.
Getting started 101:
Initially, this is (more or less) the software screen you get when you first open the application.

The first thing you want to do is import the data that will be used to construct your visual network. The great thing about Cytoscape is that it was built with Notepad or Excel in-mind. I am comfortable with Excel so I will use it to build my network consisting of protein-protein interactions (ie. I would have a list of which protein interacts with which protein).
Data import format:
The format is as such:

In this example, I have paired up my protein pairs such that I know SPAC1002.06C interacts with SPAC6G9.13C (the very first pair). Likewise, the second, third, and so forth lines represents other pairs. Cytoscape has a built-in feature which can easily remove all instances of duplicate pairs so if this is a problem, do not worry -- we will get to that soon!
Importing the data:
To upload your Excel file, go to FILE > IMPORT > Network from Table (Text, MS Excel)....

Make sure to select the appropriate columns for "Source Interaction" and "Target Interaction". Cytoscape also has an "Interaction Type" function in-case you have a file with multiple types of interactions (ie. a combination of protein interactions and genetic interactions). In our case, all pairs represent the same type of interaction (protein-protein). However, if multiple types of interactions are present and indicated by "Interaction Type", then different types of edges can be differentiated.
Importing attributes:
In Cytoscape, attributes are various descriptions of the nodes in your network. Let's say
Playing with the network:
This is the part that takes some time to explore.
Let Cytoscape organize your network-look in several ways:
Cytoscape allows you to manually drag nodes (the circles) and/or edges (the lines) however you want on the main screen. However, it is often best to let Cytoscape organize the "shape" of your network based on various built-in algorithms (more can be imported via plugins).
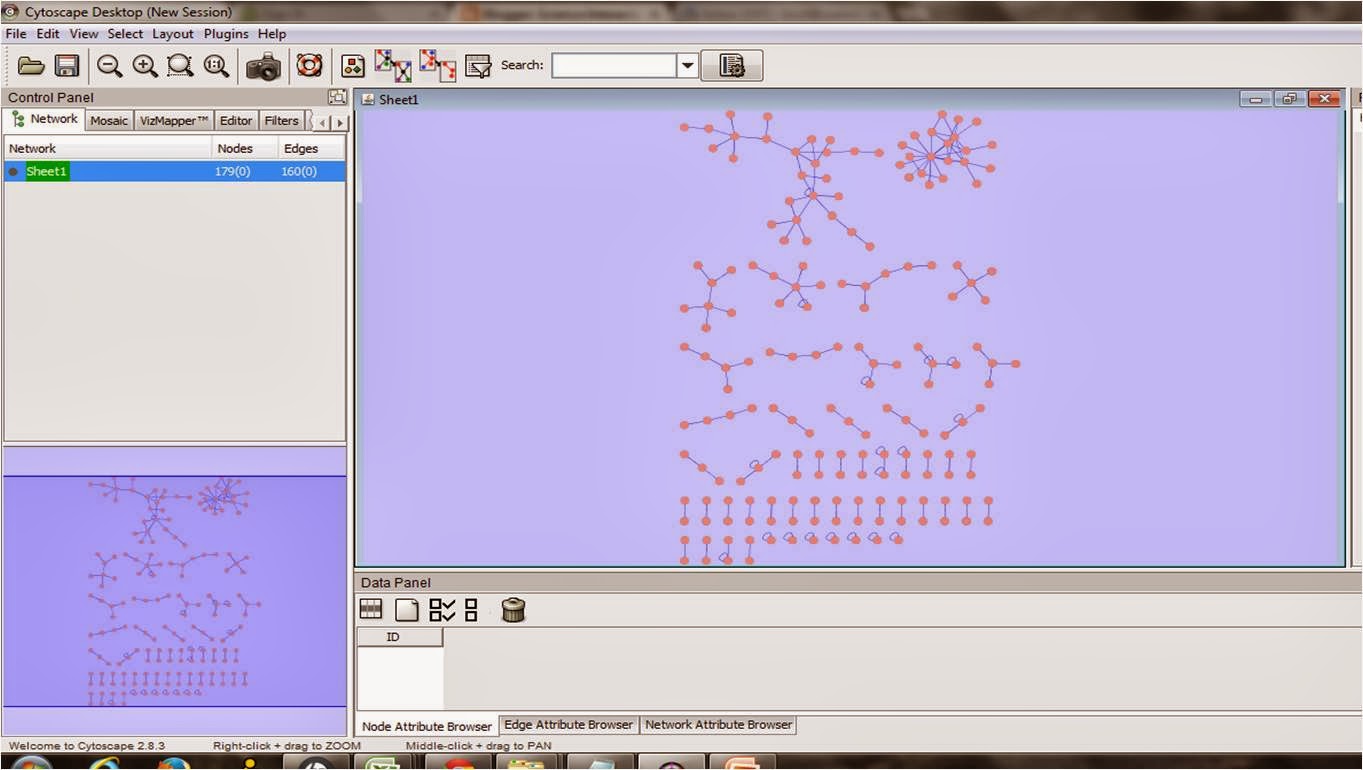
Starting with the upper toolbar, go to LAYOUT > Cytoscape Layouts. Choose any layout and see how it changes your network look. The layout seen above is Force-directed layout > (unweighted).
Zoom-in/ Zoom-out:
You can zoom in or out of the network by either scrolling with you mouse or using the zoom functions in the upper-left corner (the two Magnifying Glasses).
In the lower left corner, there is a global view of your network with a blue rectangle over it. The blue rectangle tells you how much of your network you are currently seeing in the main screen (the bigger area spanning the middle to upper-right of the screen).